Fatal-and-Non-Fatal-Shooting-Trends-Detroit-2014-2018.png
Media
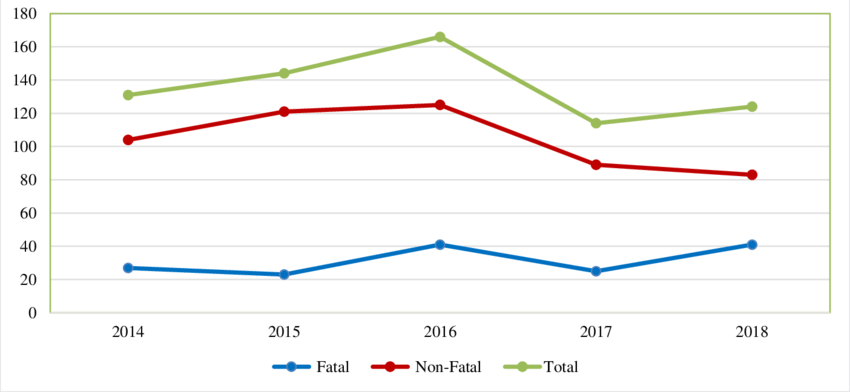
Part of Chart of Percent Difference Observed for Estimated Fatal and Non-Fatal Shootings

Part of Chart of Percent Difference Observed for Estimated Fatal and Non-Fatal Shootings